


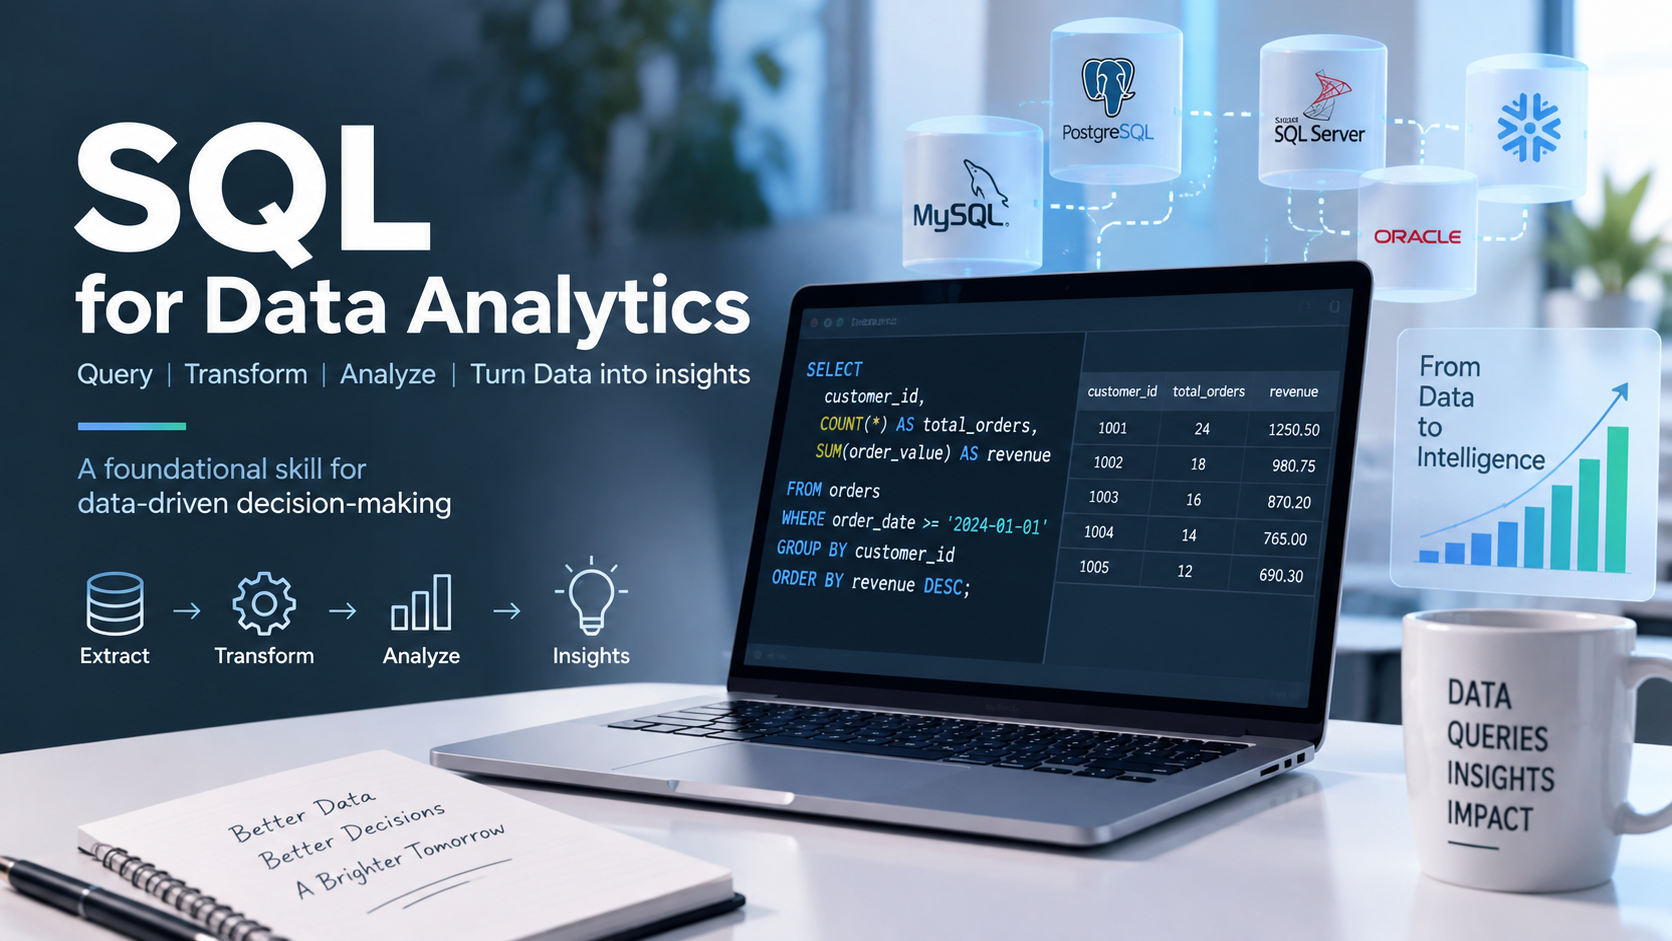
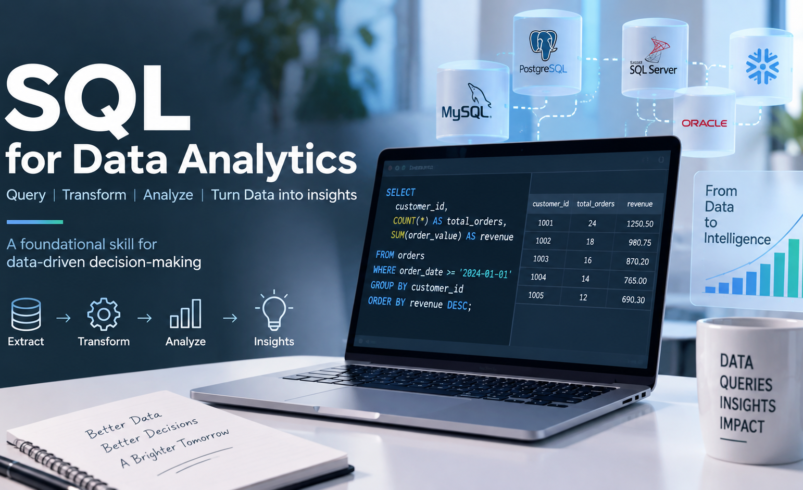

In the realm of data, Structured Query Language (SQL) stands as a fundamental skill for professionals across various industries. It is the universal language for interacting with relational databases, making it indispensable for anyone looking to extract meaningful insights from raw data. This guide explores the core concepts, applications, and benefits of SQL data analytics, demonstrating why it’s a cornerstone for data-driven decision-making.
1. Understanding SQL Data Analysis: The Foundation
At its core, SQL data analysis involves using SQL to query, manipulate, and analyze data stored in relational databases. This process transforms raw, often disparate, data points into structured, actionable information. Analysts leverage SQL to navigate vast datasets, identify patterns, calculate metrics, and prepare data for further visualization or statistical modeling. It’s the critical first step in turning data into intelligence, enabling businesses to understand trends, customer behavior, and operational efficiencies.
Architectural Foundations: ANSI SQL Standards vs. Modern Database Engines
While SQL is based on the formal ANSI/ISO standard (ISO/IEC 9075), practical implementations differ across commercial and open-source database engines. Understanding these distinctions prevents unexpected syntax errors and functional bottlenecks:
-
Dialectical Variations: PostgreSQL supports robust procedural capabilities via PL/pgSQL; Microsoft SQL Server utilizes Transact-SQL (T-SQL) with rich built-in administrative procedures; MySQL offers streamlined syntax tailored for web workloads; and Oracle employs PL/SQL for complex enterprise systems.
-
Row-Oriented (OLTP) vs. Column-Oriented (OLAP): Traditional transactional databases (e.g., standard PostgreSQL or MySQL) store table data on disk row-by-row, optimizing single-row write, update, and retrieval operations. In contrast, modern analytical data warehouses (e.g., Snowflake, Google BigQuery, ClickHouse) organize data by columns, dramatically accelerating analytical aggregation queries (
SUM,AVG) across billions of rows while compressing storage footprints.
2. The Indispensable Role of SQL in Data Analytics
SQL plays a central role throughout the entire data analytics workflow. From the initial stages of data extraction to the final aggregation of results, SQL serves as the primary language for interacting with databases. Analysts use it to:
-
Extract Data: Retrieve specific subsets of data from large databases based on defined criteria.
-
Transform Data: Clean, reformat, and standardize data to ensure consistency and accuracy. This often involves handling missing values, correcting errors, and converting data types.
-
Aggregate Data: Summarize data using functions like
SUM,AVG,COUNT,MIN, andMAXto derive key performance indicators (KPIs) and other summary statistics. -
Join Data: Combine data from multiple tables to create a comprehensive view, linking related information across different datasets.
Understanding how SQL is used in data analytics is crucial for any aspiring data professional, as it underpins nearly every data-related task.
3. Key Benefits of SQL in Data Analysis Workflows
The practical advantages of using SQL for data analysis are numerous, contributing significantly to its widespread adoption:
-
Efficiency: SQL queries are highly optimized for retrieving and processing large volumes of data quickly.
-
Precision: It allows for exact data retrieval and manipulation, ensuring accuracy in analysis.
-
Scalability: SQL databases can handle massive datasets, making SQL suitable for both small projects and enterprise-level data operations.
-
Universal Adoption: SQL is a standard language supported by virtually all relational database management systems (RDBMS), ensuring portability of skills and queries across different platforms.
-
Empowerment: It empowers analysts to directly access and manipulate data without relying on developers, accelerating the analysis process.
These benefits of SQL in data analysis highlight why it remains a foundational skill.
4. Comparative Evaluation: SQL vs. Python vs. R in Analytics Workflows
To design an optimal analytics pipeline, analysts must understand where SQL excels and where complementary analytical languages are required:
5. Starting Your Journey: Learn SQL for Data Analysis
For individuals looking to enter or advance in the data field, the path to acquiring SQL skills is accessible and rewarding. To learn SQL for data analysis, begin with understanding relational database concepts, such as tables, columns, rows, primary keys, and foreign keys. Numerous online courses, tutorials, and interactive platforms offer structured learning paths, often with practical exercises that reinforce theoretical knowledge. Consistency and hands-on practice are key to mastering SQL.
SQL Data Analysis for Beginners: Essential Concepts
Beginners should focus on mastering the core SQL commands that form the building blocks of effective data querying and manipulation:
-
SELECT: To specify which columns to retrieve.
-
FROM: To indicate the table(s) from which to retrieve data.
-
WHERE: To filter rows based on specified conditions.
-
GROUP BY: To group rows that have the same values in specified columns into summary rows.
-
ORDER BY: To sort the result set by one or more columns.
-
JOINs: To combine rows from two or more tables based on a related column between them (e.g.,
INNER JOIN,LEFT JOIN). -
Basic Aggregate Functions:
COUNT(),SUM(),AVG(),MIN(),MAX().
Intermediate & Advanced SQL Concepts for Professional Analytics
Once core querying syntax is mastered, professional data analysis relies heavily on advanced structural expressions to produce production-grade analytical models:
-
Common Table Expressions (CTEs): Defined using the
WITHclause, CTEs break complex, nested logic into modular, human-readable temporary result sets that can be referenced sequentially in downstream queries. -
Window Functions: Unlike standard
GROUP BYoperations that collapse row details into single summary metrics, window functions calculate aggregates across a designated slice (window) of rows while maintaining individual row granularity:-
ROW_NUMBER(),RANK(),DENSE_RANK(): Assign sequential ranking order to records partitioned by business dimensions. -
LEAD()andLAG(): Inspect subsequent or preceding rows to compute period-over-period growth or time-lapse metrics without self-joins. -
Running Totals: Utilize expressions like
SUM(sales_amount) OVER (PARTITION BY region ORDER BY order_date)for cumulative trend tracking.
-
-
Conditional Aggregation: Utilizing
CASE WHENstatements within aggregate functions allows analysts to pivot wide datasets and tabulate categorical metrics in a single table scan (e.g.,SUM(CASE WHEN status = 'returned' THEN 1 ELSE 0 END) AS returned_orders). -
Relational Set Operations: Combine query result sets horizontally or vertically using
UNION,UNION ALL,INTERSECT, andEXCEPT.
6. Practical Application: SQL Queries and Tools for Data Analysis
Putting SQL into practice involves writing queries to answer specific business questions and utilizing appropriate tools to manage and interact with databases.
Essential SQL Queries for Data Analysis
Here are examples of common SQL queries for data analysis:
-
Filtering Data: Retrieving sales data for a specific product category.
SELECT product_name, sales_amount FROM sales WHERE category = 'Electronics'; -
Calculating Aggregates: Finding the total sales for each region.
SELECT region, SUM(sales_amount) AS total_sales FROM sales GROUP BY region; -
Joining Tables: Combining customer information with their order details.
SELECT c.customer_name, o.order_date, o.total_price FROM customers c JOIN orders o ON c.customer_id = o.customer_id; -
Performing Subqueries: Identifying customers who have placed orders above the average order value.
SELECT customer_name FROM customers WHERE customer_id IN ( SELECT customer_id FROM orders WHERE total_price > (SELECT AVG(total_price) FROM orders) );
These SQL data analysis examples illustrate the versatility of SQL.
Advanced Production SQL Examples for Business Intelligence
1. Month-over-Month Revenue Growth Analysis (Using CTEs and Window Functions):
WITH monthly_revenue AS (
    SELECT
        DATE_TRUNC('month', order_date) AS sales_month,
        SUM(sales_amount) AS total_revenue
    FROM orders
    WHERE order_status = 'Completed'
    GROUP BY DATE_TRUNC('month', order_date)
)
SELECT
    sales_month,
    total_revenue,
    LAG(total_revenue, 1) OVER (ORDER BY sales_month) AS previous_month_revenue,
    ROUND(
        100.0 * (total_revenue - LAG(total_revenue, 1) OVER (ORDER BY sales_month)) /
        NULLIF(LAG(total_revenue, 1) OVER (ORDER BY sales_month), 0),
        2
    ) AS mom_growth_percentage
FROM monthly_revenue
ORDER BY sales_month DESC;
2. Deduplicating Records Using Window Partitioning (ROW_NUMBER):
WITH ranked_customers AS (
    SELECT
        customer_id,
        email,
        updated_at,
        ROW_NUMBER() OVER (
            PARTITION BY email
            ORDER BY updated_at DESC
        ) AS record_rank
    FROM customer_profiles
)
SELECT
    customer_id,
    email,
    updated_at
FROM ranked_customers
WHERE record_rank = 1;
7. Common Practitioner Pitfalls and Optimization
Common Data Quality Edge Cases
When performing production-level analysis, subtle SQL nuances can introduce silent inaccuracies into reporting dashboards:
-
Three-Valued Logic and NULL Values: In SQL, comparisons against
NULLyieldUNKNOWN, notTRUEorFALSE. WritingWHERE column != 'value'will quietly exclude all records where column isNULL. UseIS NULLorIS NOT NULLchecks explicitly. -
COUNT(*)vs.COUNT(column_name):COUNT(*)counts every row returned by the query, including rows containing null entries. In contrast,COUNT(column_name)calculates only non-null occurrences within that designated attribute, which can alter baseline conversion calculations. -
Integer Division Truncation: In engines such as Microsoft SQL Server and PostgreSQL, dividing two integers (e.g.,
SELECT 5 / 2;) truncates decimal points and evaluates to2. Ensure floating-point precision by casting inputs:CAST(numerator AS NUMERIC) / denominator. -
Cross Joins / Unintended Cartesian Products: Merging tables on mismatched keys or omitting join predicates can trigger cartesian explosions, causing server out-of-memory errors and duplicating financial numbers.
Query Optimization and Performance Tuning
Writing functional queries is only the first step; enterprise datasets demand queries structured for computational efficiency:
-
Avoiding Full Table Scans (
SELECT *): Explicitly select only necessary columns. In columnar data warehouses (Snowflake, BigQuery), querying unneeded columns increases disk I/O costs and warehouse billing units. -
Writing Sargable Queries: Keep indexed columns clean of wrapping functions in filter conditions. Writing
WHERE YEAR(order_date) = 2026invalidates index usage; writeWHERE order_date >= '2026-01-01' AND order_date < '2027-01-01'instead to ensure full B-tree index seeks. -
Execution Plan Analysis: Inspect query efficiency before deploying views to BI tools by prepending queries with
EXPLAINorEXPLAIN ANALYZEto identify resource-heavy table scans, hash joins, and memory spills.
8. Top SQL Data Analysis Tools and Environments
Analysts use a variety of SQL data analysis tools to facilitate their work:
-
Database Management Systems (DBMS): Popular choices include PostgreSQL, MySQL, Microsoft SQL Server, and Oracle Database.
-
SQL Clients/IDEs: Tools like DBeaver, DataGrip, SQL Developer, and pgAdmin provide graphical interfaces for writing queries, managing databases, and visualizing results.
-
Cloud Data Warehouses: Platforms such as Google BigQuery, Amazon Redshift, and Snowflake offer scalable, managed database services optimized for analytical workloads.
-
Business Intelligence (BI) Tools: Many BI tools (e.g., Tableau, Power BI) integrate directly with SQL databases, allowing analysts to connect, query, and visualize data seamlessly.
Modern Data Stack (MDS) Integration
In mature enterprise ecosystems, SQL operates alongside specialized transformation and orchestration frameworks:
-
Data Transformation via dbt (data build tool): Allows analysts to apply software engineering best practices—such as modular version control, automated schema testing, and documentation—to SQL scripts, compiling raw data tables into clean, production-grade analytics data marts.
-
Orchestration & Workflow Schedulers: Tools like Apache Airflow, Prefect, and Dagster automate and coordinate dependency-aware SQL pipeline runs on scheduled cadences.
9. Frequently Asked Questions (FAQ) About SQL Data Analytics
Is SQL hard to learn?
SQL is generally considered one of the easier programming languages to learn, especially for beginners. Its syntax is intuitive and closely resembles natural language, making it accessible for those without a programming background. Mastery comes with consistent practice.
What’s the difference between SQL and Excel for data analysis?
Excel is excellent for smaller datasets, quick calculations, and visual presentations. SQL, however, is designed for managing and querying large, structured datasets stored in databases. SQL offers superior performance, scalability, and data integrity for complex analytical tasks that Excel cannot handle efficiently.
Can SQL be used for big data?
Yes, SQL is extensively used with big data technologies. While traditional SQL databases might struggle with petabyte-scale data, SQL-on-Hadoop engines (like Hive, Presto) and cloud data warehouses (BigQuery, Redshift, Snowflake) allow analysts to use SQL syntax to query and analyze massive datasets distributed across clusters.
What career opportunities require SQL data analysis skills?
Many roles demand strong SQL data analytics skills, including Data Analyst, Business Intelligence Analyst, Data Scientist, Data Engineer, Database Administrator, and Marketing Analyst. It’s a core competency across the data profession.
How is SQL used alongside Business Intelligence (BI) tools?
Most modern BI platforms (e.g., Power BI, Tableau, Looker) connect natively to databases via live SQL connections or extract modes. Analysts frequently author optimized SQL queries or database views to handle heavy aggregation, data joining, and schema cleansing before feeding clean data models into BI interfaces for dashboard rendering.
What is the difference between an analytical database (OLAP) and an operational database (OLTP)?
Online Transaction Processing (OLTP) engines are engineered for rapid, row-based read/write speeds, concurrency, and ACID transactions supporting web and retail apps. Online Analytical Processing (OLAP) warehouses utilize columnar storage and parallel compute nodes designed to scan, aggregate, and filter millions of rows simultaneously for business metrics.
Is SQL enough to land an entry-level Data Analyst job?
While SQL is widely considered the most rigorously tested technical competency during data analyst technical screens, competitive candidates typically pair SQL with a visualization tool (such as Tableau or Power BI), foundational statistical proficiency, and basic scripting skills (Python or R) for end-to-end data manipulation.
10. Conclusion: The Enduring Value of SQL in Data Analytics
SQL data analytics remains an indispensable skill in the modern data landscape. Its ability to efficiently query, manipulate, and extract insights from structured data makes it a cornerstone for business intelligence and data science. Whether you are just starting your data journey or looking to enhance your existing toolkit, developing strong SQL skills will significantly empower your ability to understand data and drive informed decisions. The enduring relevance of SQL ensures that proficiency in this language will continue to open doors to numerous opportunities in a data-driven world.

