





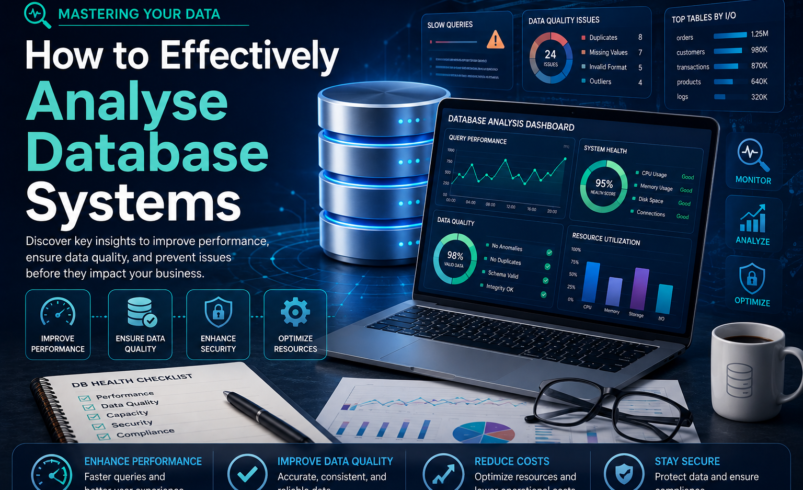

Reliable and efficient data management underpins nearly every successful operation. Databases are the backbone of applications, business intelligence, and critical decision-making. To ensure these systems operate at peak performance and maintain data integrity, it’s essential to regularly analyse database systems. This proactive approach, known as database analysis, goes beyond simple monitoring; it involves a deep examination of various components to identify potential issues, optimize performance, and secure data assets before they impact operations.
Benefits of Database Analysis: Why Regular Assessment Matters
Regular and thorough database analysis yields significant advantages, directly impacting an organization’s operational efficiency, data reliability, and strategic capabilities. Understanding the benefits of database analysis highlights its value as a core practice for any data-driven enterprise.
Enhancing System Performance and Responsiveness analyse database
One of the primary outcomes of effective database analysis is a marked improvement in system performance. By identifying and addressing bottlenecks, organizations can achieve faster query execution times, leading to more responsive applications and a smoother user experience. This database performance analysis directly translates to increased productivity and reduced frustration for end-users.
Mitigating Data Quality Issues in Database Systems
Poor data quality can lead to flawed insights, incorrect decisions, and operational inefficiencies. Database analysis provides the mechanisms to identify and resolve data quality issues in database systems, such as inconsistencies, duplicate records, missing values, and formatting errors. Ensuring data integrity is crucial for accurate reporting and reliable business processes.
Proactive Problem Identification and Resource Optimization in analyse database
Regular analysis allows for the early detection of potential problems, preventing minor issues from escalating into major outages. A comprehensive database health check helps in understanding resource utilization, enabling better capacity planning and optimizing hardware and software investments. This proactive stance reduces operational costs and enhances system stability.
Summary of Core Benefits Across Operational Layers
| Operational Focus | Primary Metric Tracked | Business Impact |
|
Query Performance
|
Execution time, Latency (p95/p99), IOPS |
Faster end-user load times, lower compute bills |
|
Data Quality
|
Anomaly counts, Schema drift, Null rates |
Reliable business intelligence, reduced report errors |
|
Capacity & Health
|
Buffer cache hit ratio, Storage growth rate |
Zero unexpected downtime, optimized hardware costs |
|
Security & Compliance
|
Failed login attempts, Audit trails |
Adherence to SOC 2, HIPAA, and GDPR standards |
Key Areas to Analyse Database for Comprehensive Insights
To gain a holistic understanding of a database system’s state, it’s necessary to scrutinize several key areas. A thorough process to analyse database components ensures no critical aspect is overlooked.
1. Database Performance Analysis: Identifying Bottlenecks
This area focuses on the operational efficiency of the database. It involves examining metrics such as query execution times, I/O operations per second (IOPS), CPU utilization, memory consumption, and lock contention. Understanding these metrics is fundamental to database performance analysis and provides insights into how to analyze database performance effectively to pinpoint specific bottlenecks.
Diagnosing Concurrency and Lock Contention
High resource utilization is often a symptom rather than the root cause. When analyzing performance under high transaction volumes, evaluate:
-
Blocking Chains: Trace long-running transactions holding exclusive locks (
X) on shared resources, preventing other sessions from reading or writing. -
Deadlock Graphs: In engines like SQL Server or PostgreSQL, review automated deadlock logs to identify circular dependency issues between concurrent transactions.
-
Transaction Isolation Levels: Evaluate whether switching from strict serialized transactions to Read Committed Snapshot Isolation (RCSI) or snapshot-based isolation balances data consistency with read throughput.
2. Database Structure Analysis: Schema and Index Review
The underlying design of a database significantly impacts its performance and maintainability. Database structure analysis involves reviewing table schemas, relationships between tables, indexing strategies, and the level of normalization or denormalization. An optimized structure can dramatically improve query speeds and reduce storage requirements.
Index Overhead and Maintenance Considerations
While indexes accelerate search operations, redundant or unmaintained indexes incur measurable penalties:
-
Write Amplification: Every
INSERT,UPDATE, orDELETErequires the database engine to update all corresponding B-Tree leaf pages, slowing write operations. -
Unused/Duplicate Indexes: Query dynamic management views (e.g.,
sys.dm_db_index_usage_statsin SQL Server orpg_stat_user_indexesin PostgreSQL) to locate and drop zero-read indexes consuming memory and disk space. -
Index Fragmentation: High logical fragmentation increases disk I/O. Incorporate automated index reorganization or rebuild thresholds based on table size and update volume.
3. Assessing Data Quality Issues in Database Content
Beyond performance, the integrity and accuracy of the data itself are paramount. This assessment involves methods for detecting duplicate entries, identifying missing or null values, checking for incorrect data formats, and verifying referential integrity constraints. Addressing data quality issues in database content ensures that information is reliable for all applications.
4. Performing a Database Health Check: Security and Configuration
A comprehensive database health check extends to security postures and configuration settings. This includes reviewing user permissions, access controls, encryption settings, backup and recovery strategies, and server configuration parameters. Ensuring these elements are correctly configured is vital for data protection and system resilience.
Compliance and Disaster Recovery Verification
A robust database health check verifies compliance readiness (e.g., SOC 2, HIPAA, PCI-DSS 4.0, and GDPR Article 32):
-
Backup Integrity Checks: Ensure automated backups are not only generated but regularly validated using automated test-restores to calculate precise Recovery Point Objectives (RPO) and Recovery Time Objectives (RTO).
-
Encryption Standards: Confirm Transparent Data Encryption (TDE) is enforced at rest and TLS 1.3 is configured for data in transit.
-
Privilege Audits: Eliminate orphaned database users and implement Role-Based Access Control (RBAC) following the principle of least privilege.
Practical Steps: How to Analyse Database Performance and Optimize Queries
Conducting a practical analyse database requires a systematic approach. Understanding how to analyze database performance and implement effective optimizations is a critical skill for database professionals.
Step 1: Monitoring and Collecting Performance Metrics
The first step involves gathering relevant data. This can be achieved using built-in database management system (DBMS) tools, operating system monitors, or specialized third-party monitoring solutions. Key metrics to collect include query response times, CPU usage, disk I/O, memory usage, and network latency. Consistent monitoring is foundational for any database performance analysis.
Step 2: Implementing Strategies to Optimize Database Queries
Once performance bottlenecks are identified, specific strategies can be employed to optimize database queries. These include:
-
Indexing: Creating appropriate indexes on frequently queried columns.
-
Query Rewriting: Restructuring inefficient SQL statements, avoiding
SELECT *, using JOINs effectively, and minimizing subqueries. -
Execution Plan Analysis: Examining the query execution plan to understand how the database processes a query and identify costly operations.
-
Batch Processing: Grouping multiple operations into a single transaction to reduce overhead.
-
Materialized Views: Pre-calculating and storing complex query results for faster retrieval.
Hands-on Example: Execution Plan Analysis & Query Refactoring
Consider a query retrieving recent customer orders that triggers a full table scan and excessive logical reads:
Inefficient Pattern (Full Scan & Implicit Conversions):
-- Causes sequential scan and ignores indexes due to wildcard & function wrapper
SELECT *
FROM Orders
WHERE UPPER(Status) = 'COMPLETED'
  AND YEAR(OrderDate) = 2026;
Optimized Pattern (Index Seek & SARGable Predicates):
-- SARGable syntax enabling targeted Index Seek
SELECT OrderID, CustomerID, OrderDate, TotalAmount
FROM Orders
WHERE Status = 'Completed'
  AND OrderDate >= '2026-01-01'
  AND OrderDate < '2027-01-01';
Execution Plan Diagnostic Tip: Inspect the visual or textual plan for Index Scan vs. Index Seek and watch for high-cost Sort operators or unindexed Hash Match joins that indicate missing composite indexes.
Step 3: Capacity Planning and Resource Allocation
Analysis provides the data needed for informed capacity planning. By understanding current and projected resource demands, organizations can make strategic decisions about scaling hardware (CPU, RAM, storage) and software licenses. This ensures that as data volumes grow or user loads increase, the system can continue to perform optimally, allowing you to effectively analyse database resource needs.
Step-by-Step Database Analysis Audit Checklist
-
1. System Resource Baseline: Measure CPU peak hours, memory pressure, and target a minimum 95%+ Buffer Cache Hit Ratio.
-
2. Storage & Disk Throughput: Inspect disk queue length, verify IOPS availability, and calculate data/log file growth trends.
-
3. Slow Query Capture: Configure query capture thresholds (e.g., queries running > 1000ms) to isolate top resource consumers.
-
4. Index & Schema Health: Locate non-SARGable queries, missing index suggestions, and remove redundant duplicate indexes.
-
5. Transaction Integrity: Check open transaction duration, locking/blocking contention, and deadlock frequency.
-
6. Backup & Security Validation: Audit role permissions, test database backup restorability, and confirm encryption key rotation.
Essential Tools for Database Analysis
A variety of tools are available to assist in performing thorough database analysis, ranging from native utilities to sophisticated third-party platforms. Selecting the right tools for database analysis can significantly streamline the process.
Native Database Management System Utilities
Most DBMS platforms provide their own set of utilities for monitoring and analysis. Examples include:
-
SQL Server Management Studio (SSMS): With its Activity Monitor, Query Store, and execution plan analysis features.
-
MySQL Workbench: Offering performance dashboards and query optimization tools.
-
Oracle Enterprise Manager (OEM): Providing comprehensive performance monitoring, diagnostics, and tuning capabilities.
-
PostgreSQL pg stat statements & EXPLAIN: Built-in commands for granular query analysis.
Third-Party Performance Monitoring and Analysis Platforms
For more advanced capabilities, specialized third-party solutions offer enhanced monitoring, alerting, and reporting. These platforms often provide cross-DBMS support, historical data analysis, and predictive analytics. They are invaluable for deep database performance analysis across complex environments. Examples include SolarWinds Database Performance Analyzer, Datadog, and Dynatrace.
Open-Source & Cloud-Native Observability Tools
In addition to enterprise platforms, open-source stacks provide granular, cost-effective instrumentation:
-
Prometheus & Grafana: Utilizing exporters like
mysqld_exporterorpostgres_exporterto build real-time visual dashboards and threshold alerts. -
Cloud-Native Diagnostics: AWS Performance Insights, Azure SQL Insights, and Google Cloud Database Center for automated root-cause analysis and machine learning-driven tuning recommendations.
Data Profiling and Quality Tools
When the focus is specifically on data integrity, dedicated data profiling and quality tools are essential. These tools can scan large datasets to identify patterns, anomalies, and inconsistencies, helping to pinpoint data quality issues in database systems. Examples include Informatica Data Quality, Talend Data Quality, and various open-source data profiling libraries. These are crucial tools for database analysis when data accuracy is paramount.
Automating Data Quality in CI/CD Pipelines
Modern engineering teams increasingly integrate automated data validation frameworks directly into their development pipelines:
-
Great Expectations / Soda Core: Open-source Python libraries that run automated assertion tests against database tables (e.g., asserting column null rates, unique constraints, and schema drift) prior to deploying pipeline code.
-
dbt (data build tool): Incorporates out-of-the-box data testing and documentation during transformation workflows.
Frequently Asked Questions About Database Analysis
How often should I analyse database systems?
The frequency depends on several factors: the criticality of the database, the rate of data change, and the system’s performance requirements. For critical production systems, a daily or weekly database health check might be appropriate, with deeper performance and structure analyses conducted quarterly or bi-annually. Development and staging environments might require less frequent, but still regular, analysis.
What are the biggest challenges when you analyse database performance?
Common challenges include the sheer volume of data, the complexity of modern database systems, identifying the root cause among interconnected components (application, network, storage), and the need for specialized expertise. Resource constraints, both in terms of tools and skilled personnel, can also pose significant hurdles when you analyse database performance.
Can database analysis help with security?
Database analysis plays a crucial role in security by identifying misconfigurations, weak access controls, unpatched vulnerabilities, and suspicious activity patterns. Regular security audits, as part of a broader analysis, help ensure compliance with regulations and protect sensitive data from unauthorized access or breaches.
What is the difference between database monitoring and analyse database?
Database monitoring is a real-time, passive process that alerts administrators when thresholds are crossed (e.g., CPU > 90% or disk space is running low). Database analysis is a diagnostic, proactive evaluation that examines structural configurations, query execution plans, access patterns, and data integrity to identify root causes and optimize long-term efficiency.
How does analyse database differ across Relational (SQL) vs. NoSQL systems?
Relational database analysis focuses heavily on normalization, foreign keys, B-Tree indexes, and complex multi-table joins. In contrast, NoSQL analysis (e.g., MongoDB, DynamoDB, Cassandra) focuses on partition key design, data access patterns, sharding efficiency, read/write consistency levels, and document unnesting bottlenecks.
Conclusion: The Continuous Journey to analyse database Operations
Regular and systematic database analysis is not merely a task; it’s a fundamental discipline for maintaining robust, efficient, and reliable data infrastructure. From enhancing performance and ensuring data quality to proactively identifying issues and optimizing resources, the benefits are far-reaching. By embracing the practices and tools for database analysis, organizations can ensure their data assets remain a source of strength, driving informed decisions and sustained operational excellence. To effectively analyse database systems is to invest in the longevity and success of your entire data ecosystem.

